Open-Meteo forecasts, National Weather Service warnings and a satellite-and-radar map, captured and measured, then set beside Windy.com and weather.gov.
Tested 2026-09-27Build 537, local copyDesktop capture 20:13:56ZPhone capture 20:14:02ZPublisher LABS, which also makes this tool
CH 04labs.llc/weather/captured 20:13:56Z
12345
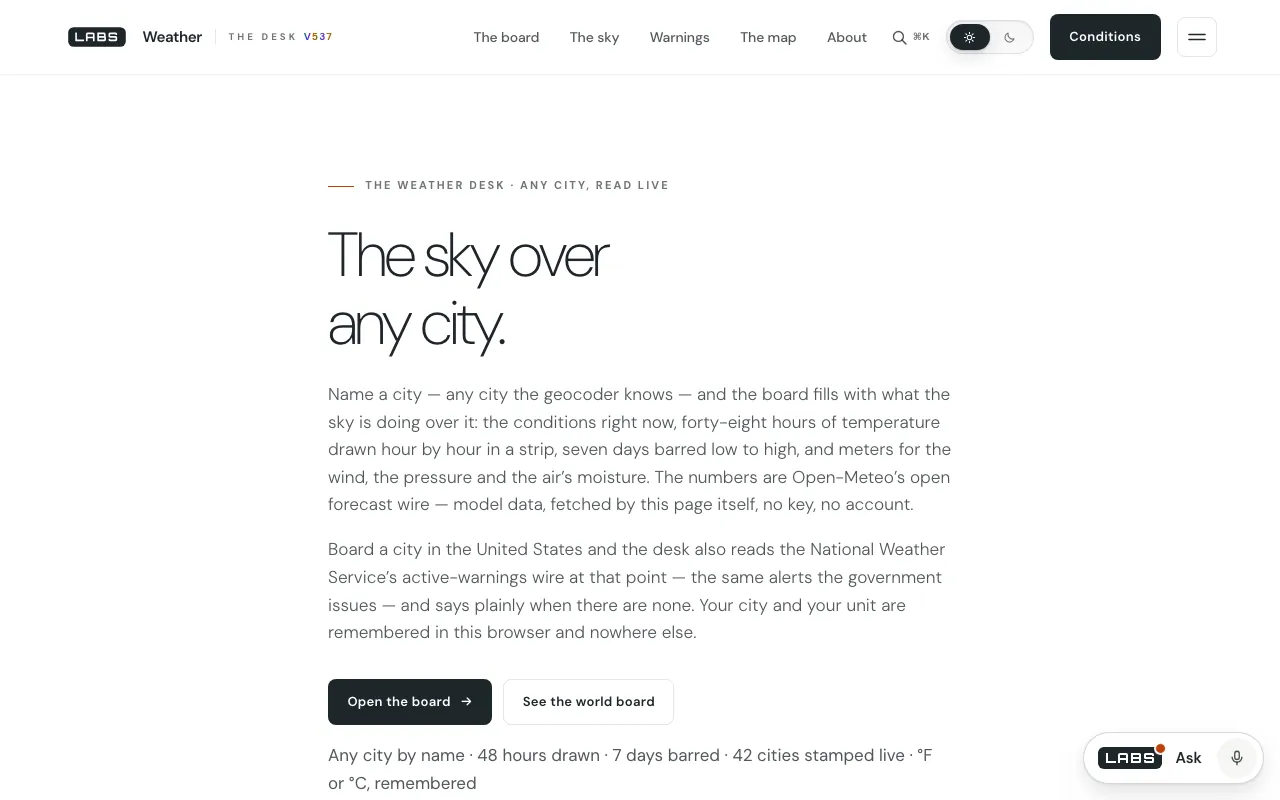
Callouts · desktop capture, 1280 × 800
1Callout 1: The eyebrow: “The weather desk · any city, read live”.
2Callout 2: “The numbers are Open-Meteo’s open forecast wire — model data, fetched by this page itself, no key, no account.”
3Callout 3: US cities also get the National Weather Service’s active warnings — and the page says plainly when there are none.
4Callout 4: The inventory: any city by name, 48 hours drawn, 7 days, 42 cities stamped live, °F or °C remembered.
5Callout 5: “The sky” in the navigation leads to the satellite, radar and lightning map below this first screen.
Segment 1 · On screen
What it is, and who it is for
Weather is a live desk for any city by name: current conditions, 48 hours of temperature, seven days drawn from low to high, National Weather Service warnings for US points, a board of 42 world cities, and a sky map of satellite, radar and lightning with a model forecast clock.
It is for anyone checking a place, travellers comparing several, and people who want the satellite and radar picture without installing an app or opening an account.
Segment 2 · Behind the picture
How it works
There is no server in the middle: the page’s script fetches everything from your browser (app.js lines 1–8). One refresh is three separate reads — the Open-Meteo forecast for your city, with temperature, humidity, apparent temperature, weather code, wind and gusts, pressure, 48 hours and seven days (lines 155–161); the NWS alerts at that point if it is in the US (line 191); and a single multi-point Open-Meteo request that stamps all 42 world cities at once (line 208). Each read settles on its own, so a slow warnings wire never blanks the forecast. Weather codes are printed in the WMO’s own words (lines 18–26). It refreshes every ten minutes, only while the tab is visible.
The sky map goes furthest. It loads a self-hosted MapLibre and assembles layers from national services — NASA GIBS satellite, NOAA nowCOAST radar and lightning, Canada’s MSC GeoMet radar, Germany’s DWD radar — plus Open-Meteo model grids (skymap.js lines 40–43). Its list of frames comes from each service’s own capabilities, never from the clock; every frame prints its UTC and local time, an old layer says “held” and how old, and a step with failed tiles says “partial” (lines 33–39).
What it reads
api.open-meteo.com /v1/forecast and geocoding-api.open-meteo.com, from your browser
api.weather.gov /alerts/active, US points only, from your browser
Sky map: NASA GIBS, NOAA nowCOAST, MSC GeoMet, DWD, Open-Meteo grids and NOAA tropical layers, on OpenFreeMap base styles
Segment 3 · The test
What we measured, and when
The page came back from the local copy at 20:15:01 UTC at 57,309 bytes. In the same second we made the forecast read the page makes, for Miami: 5,024 bytes in 0.40 seconds, 168 hourly points, seven daily rows, the America/New_York time zone, and a current 28.6 °C under weather code 0 — clear sky — on a 15-minute interval.
The NWS read at the same point took 1.02 seconds and returned two active alerts: a Coastal Flood Advisory and a Rip Current Statement. That is the kind of official notice a model forecast alone would never show, and it arrives beside the forecast without holding it up. Our desktop capture (20:13:56 UTC) is the first screen, where the page describes its own wiring; the code matches the description. We did not capture the sky map itself, which needs WebGL.
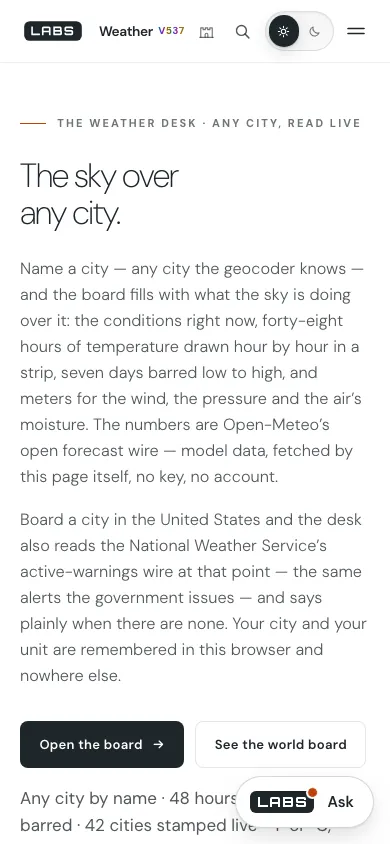
390 × 84420:14:02Z
12
Callouts · phone capture, 390 × 844
1Callout 1: The warnings paragraph at 390 pixels, readable without zooming.
2Callout 2: In the first screen the Ask launcher covers part of the inventory line. We did not test it on scroll.
Segment 4 · Other channels
Beside Windy.com and National Weather Service
Each comparator was checked on the date shown. We say what each does better before we say where Weather goes further.
Checked 2026-09-27 20:19 UTC · the page returned only its title; verified from windy.com pages and its App Store listing via search
What it is
An interactive forecast map with the leading global models and many local ones, more than fifty layers, radar and satellite.
What it does better
Far more layers and models, including local high-resolution ones, a richer point forecast, and 15-day ECMWF and GFS on Premium.
Where Weather goes further
Weather states the age of every map layer and marks held or partial frames instead of looping a picture that looks current; it puts the NWS’s own warnings beside the forecast; and every source it reads is keyless, straight from your browser.
The US government’s forecast service: a warnings map, local forecasts by city or ZIP, radar, satellite, rivers and air quality.
What it does better
The authority for US warnings, with forecaster detail, hydrology, fire weather and air quality the labs desk does not carry.
Where Weather goes further
Weather works for any city the geocoder knows and keeps a live board of 42 world cities, and its single map combines GOES, Himawari and VIIRS satellite with US, Canadian and German radar and lightning.
Segment 5 · Dropouts
Where it falls short
The city board charts hourly temperature only — no hour-by-hour rain, wind or cloud.
Official warnings exist only for US points; a city in Europe or Asia shows none.
Seven days of forecast, against fifteen on Windy Premium.
The moving map needs WebGL; without it the map says it cannot draw, leaving the boards.
Segment 6 · End card
The verdict
Weather’s distinction is candour about time: every frame dated, every stale layer called stale. Its forecast is thinner than Windy’s and its warnings stop at the US border, but it will not pass off an old sky as a new one.